Ask your ops team what it costs to close a ticket and you'll get a number. Somewhere between six and sixty dollars, depending on whose benchmark you trust. Ask what it costs to not close one and the room goes quiet. That second number is the one that matters, and almost nobody tracks it.
Here's what we keep getting wrong. We price a ticket by the work it takes to resolve. But a cloud-ops ticket really has two prices. One is the labor, small and predictable. The other is the damage if it's handled badly or left to rot, anywhere from a little wasted spend to a seven-figure breach. Treat those as the same dollar and you do what most teams do: pay senior engineers to clear noise while the genuinely dangerous tickets sit untouched.
The labor is cheap. The exposure isn't.
The labor side is well understood. HDI and MetricNet benchmark a ticket between $6 and $62. Specialist cloud work runs higher, but it's still bounded. Nobody's company gets killed by ticket labor.
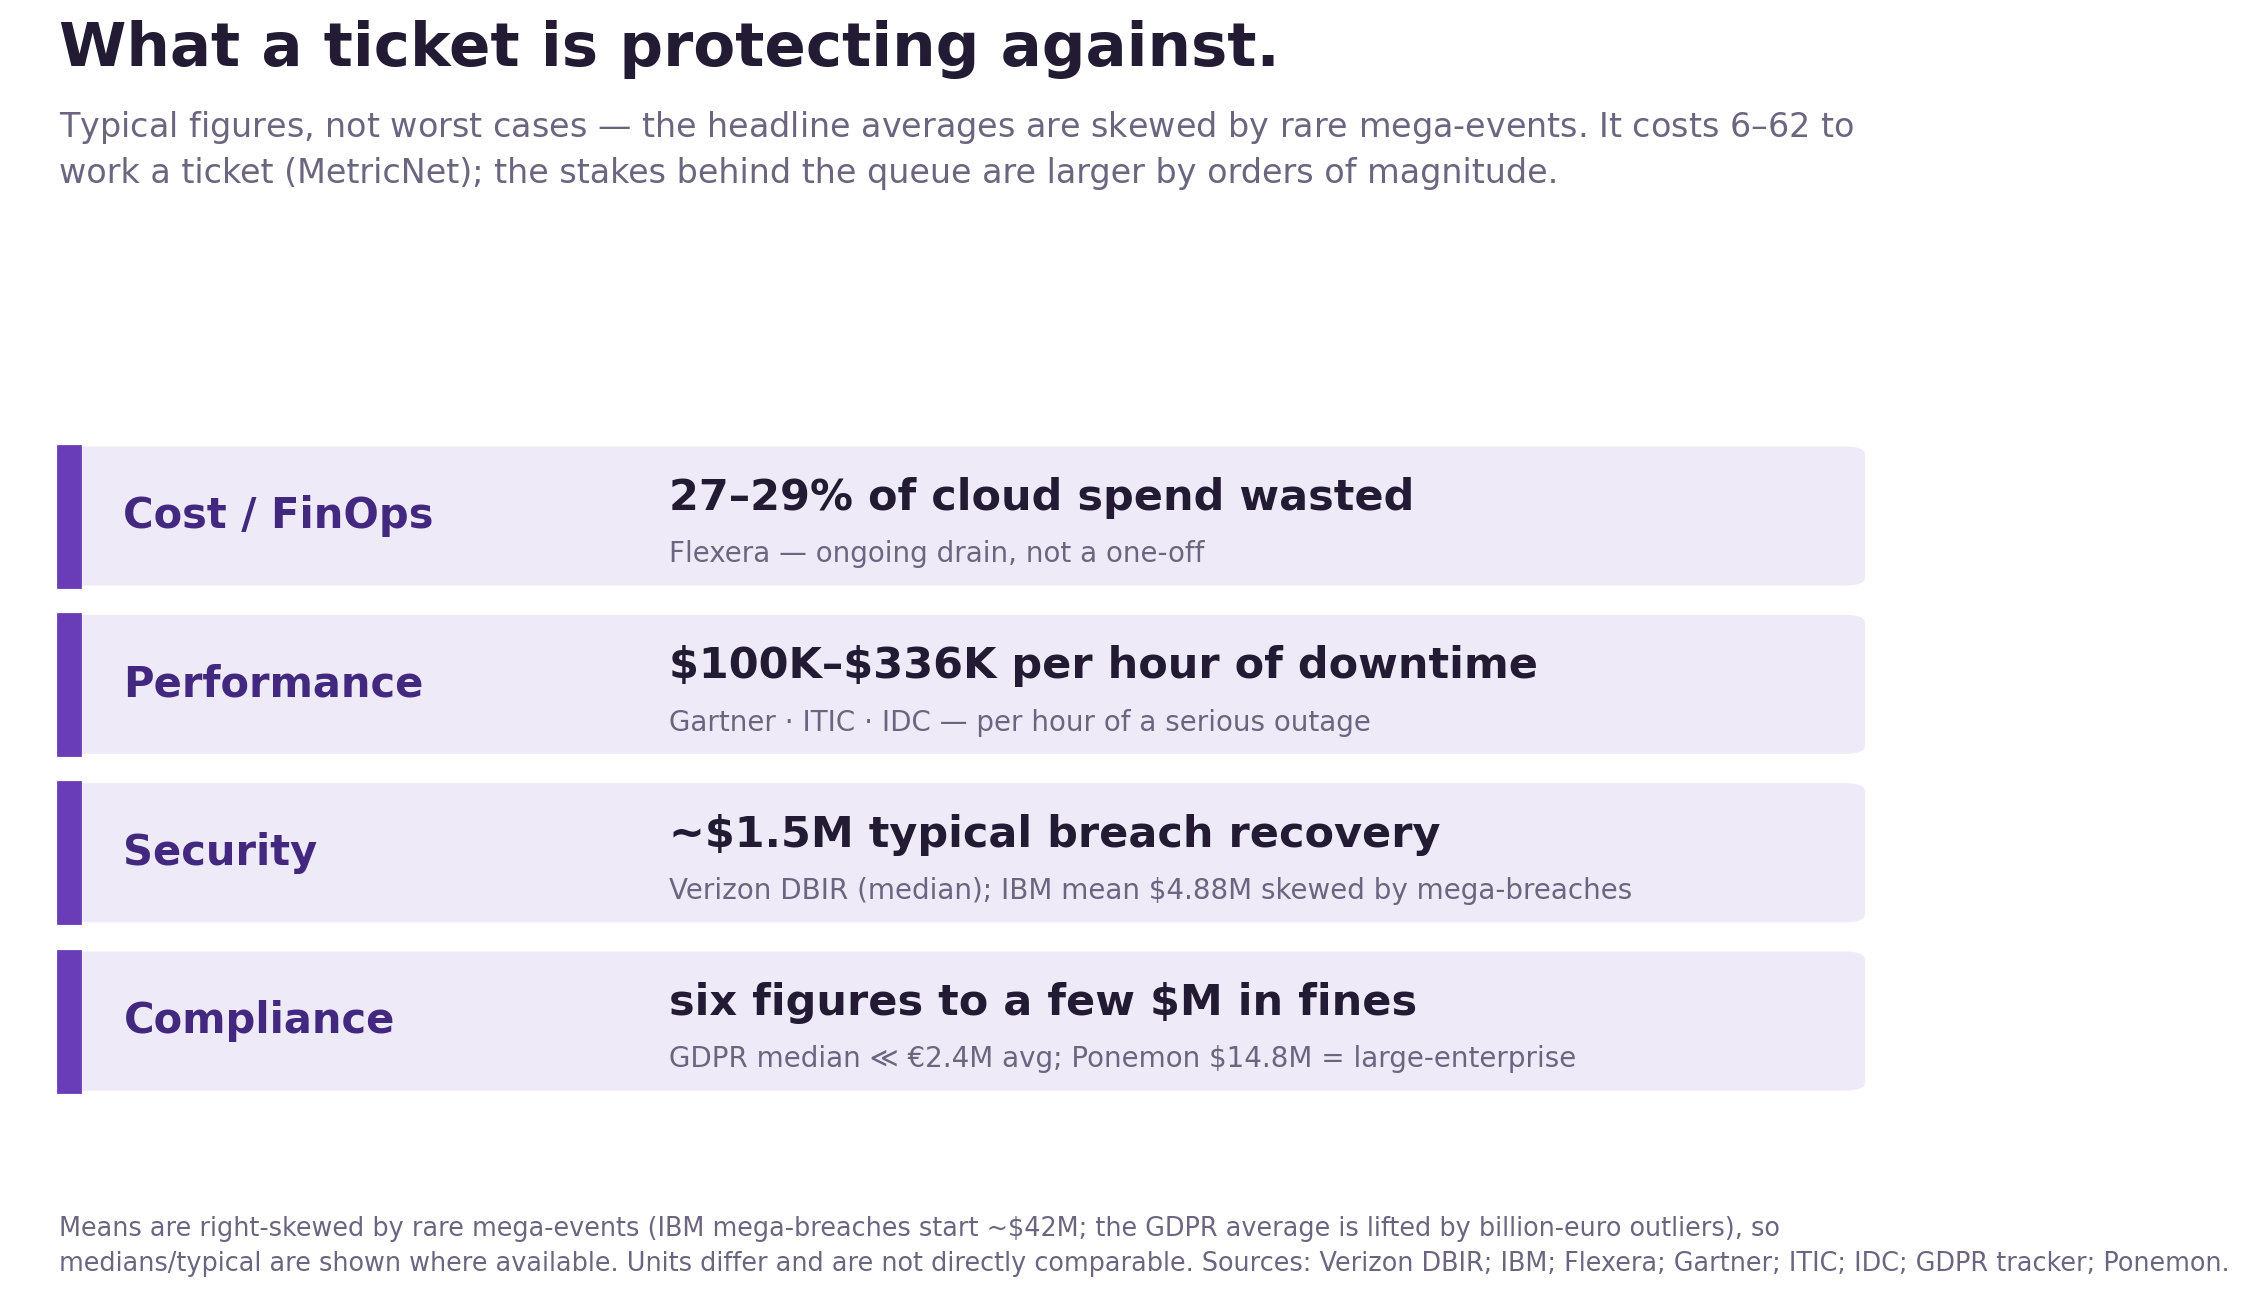
The exposure side is where it gets serious, and you don't have to guess at it. The analysts have already put numbers on what each domain is up against:
- Cost. Most companies waste a quarter to a third of their cloud bill on idle and oversized resources, every month (Flexera). That's a slow leak, not a one-time hit.
- Performance. A serious outage runs somewhere between $100K and $336K an hour (IDC, Gartner, ITIC). It's a rate, so a contained blip costs a fraction of that.
- Security. A typical breach recovery lands around $1.5M (Verizon's median). The famous $4.88M figure from IBM is an average, dragged up by rare mega-breaches.
- Compliance. Miss a control and the fines start in six figures and climb from there.
Same handful of dollars to work each of those tickets. Wildly different consequences for getting them wrong.
A few things these numbers won't tell you
Let me be straight about the data, because it's easy to abuse. The figures are in different units. A percentage here, an hourly rate there, a per-breach total somewhere else. They're company-wide or per-event, not per-ticket. And the scary averages are usually skewed by a few catastrophes, so where I could, I led with the median instead.
There's also no honest benchmark for how many tickets one engineer handles. What we do know is that the volume is punishing. A SOC sees something like 4,400 alerts a day and investigates maybe a third. Two out of three companies are sitting on six figures of open vulnerabilities. The exact numbers wobble. The gap, cheap to work, expensive to miss, doesn't.
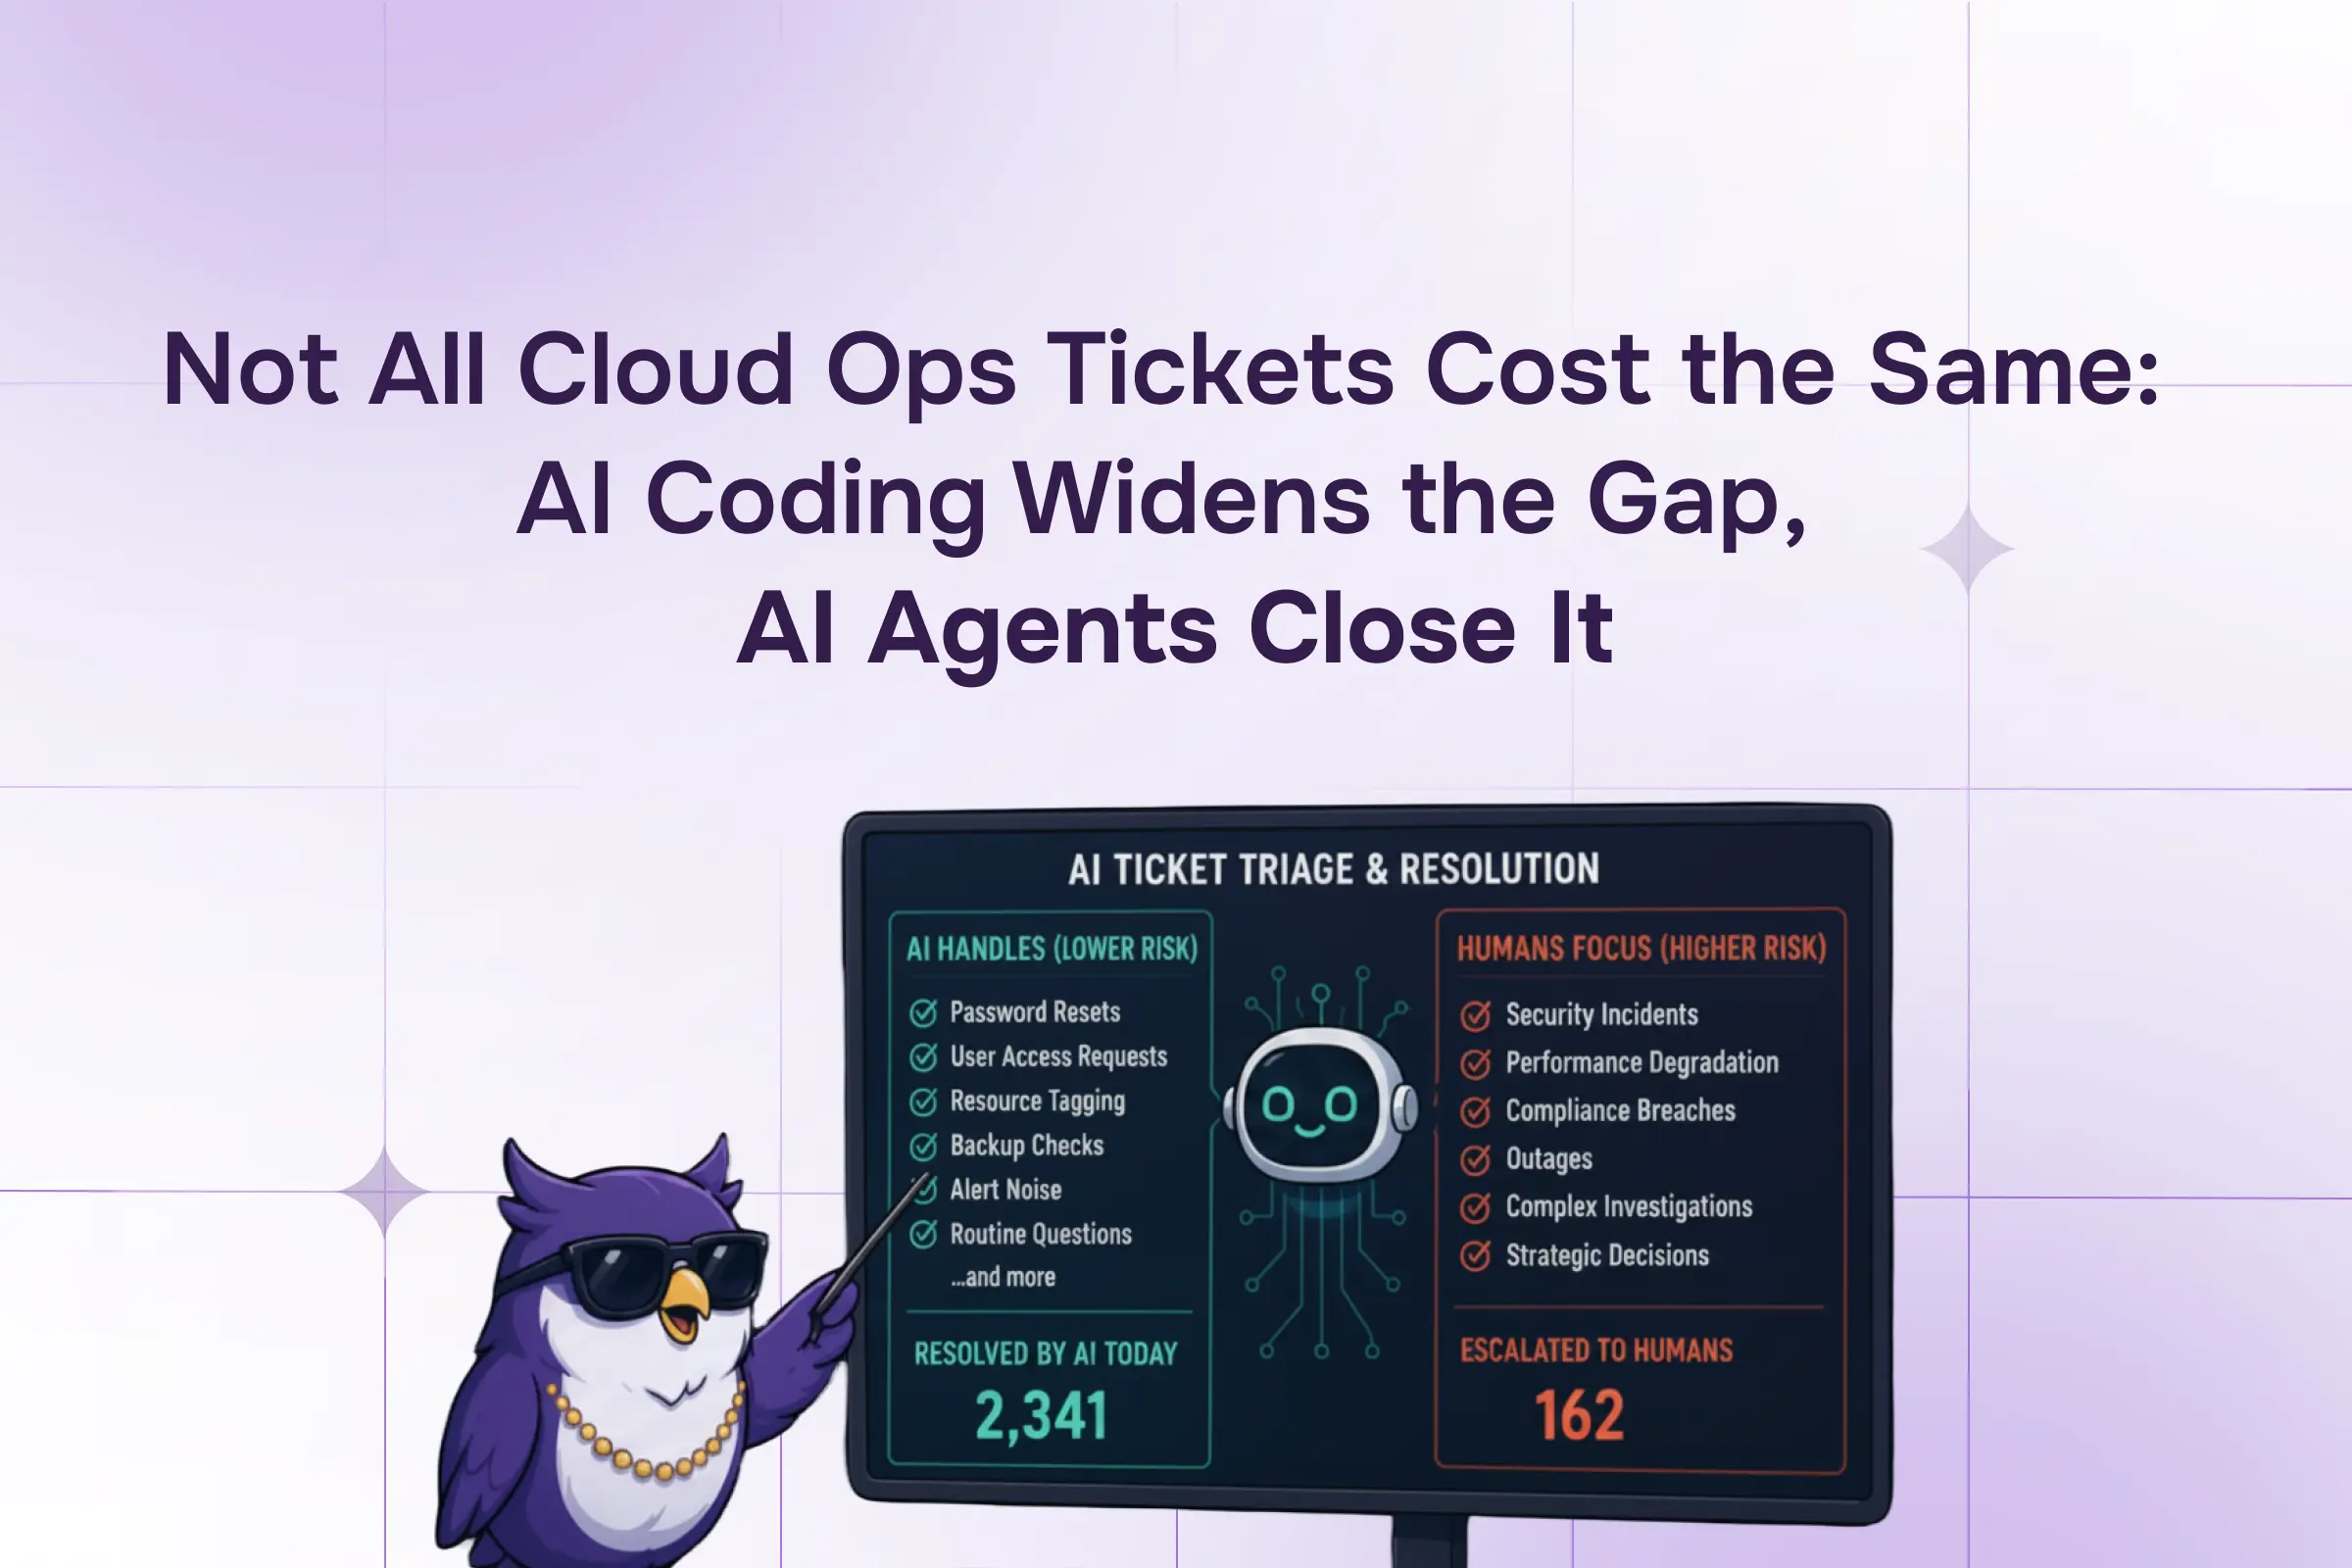
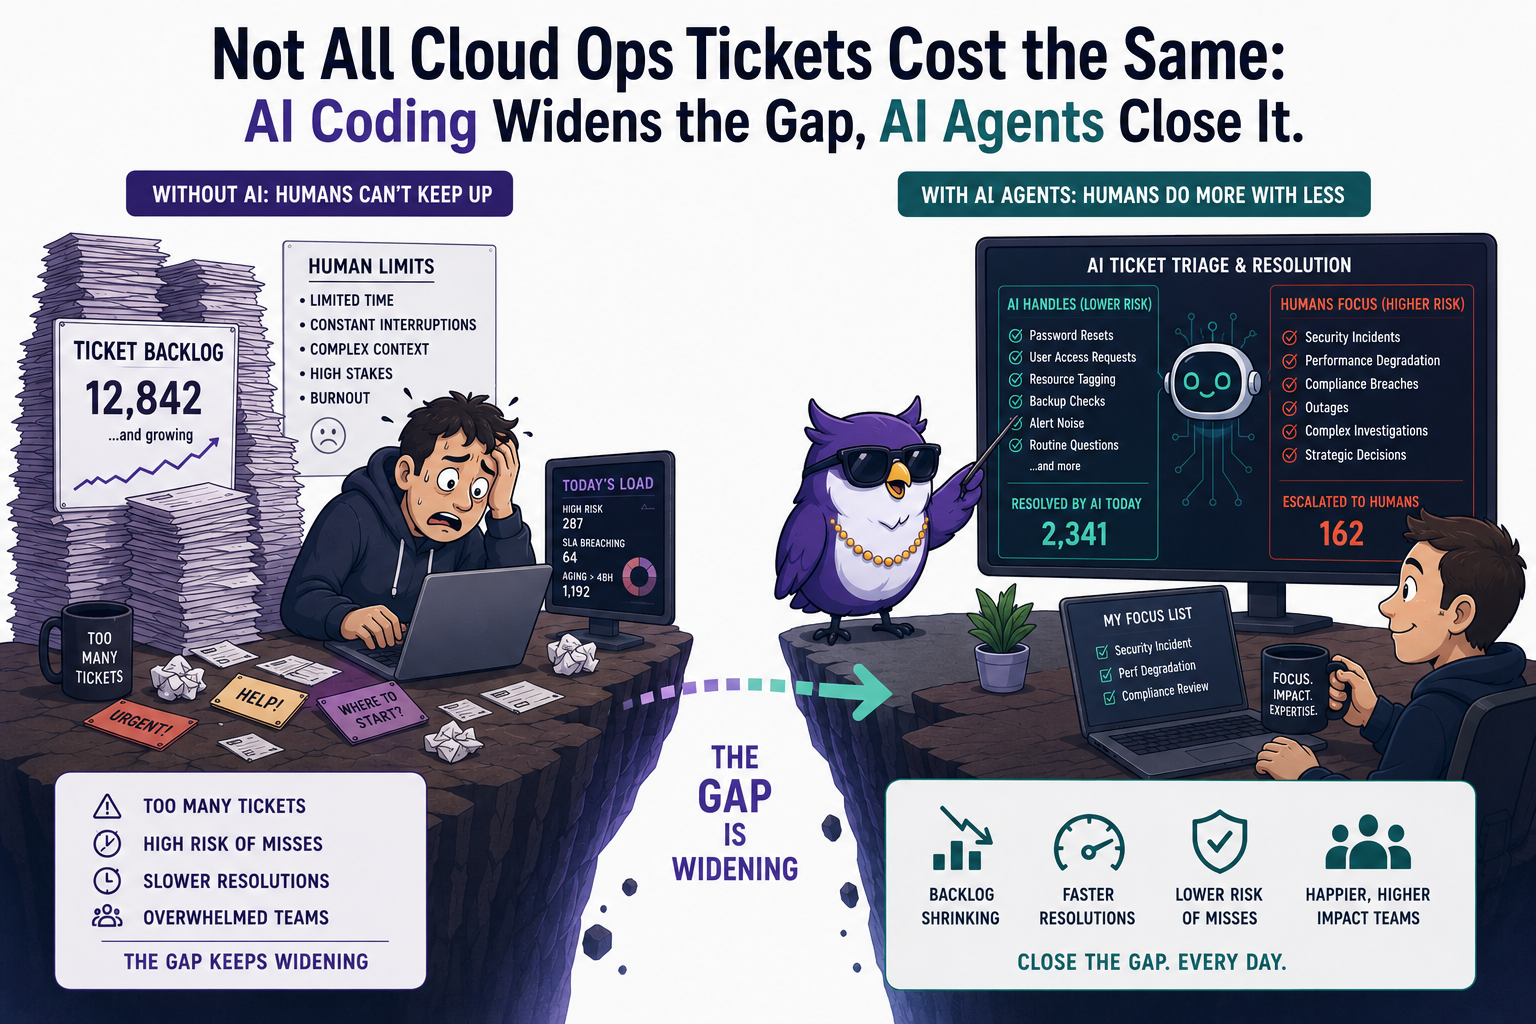
AI coding is widening the gap, fast
Most of that exposure only bites because so much of the queue never gets touched. This isn't a small tail at the bottom of the list. Tenable found two-thirds of organizations carrying 100,000-plus open vulnerabilities, with critical ones unpatched for 252 days on average. Edgescan says roughly 45% never get fixed at all. Even the flaws attackers are actively exploiting only got remediated 38% of the time last year.
Now AI is pouring fuel on the fire. Developers using AI assistants ship code three to four times faster, and about 45% of AI-written code ships with a vulnerability, nearly triple the human rate. One team watched its monthly security findings climb from a thousand to over ten thousand in six months. More AI means more apps, more apps mean more cloud to run, and AWS alone hands you 200-plus services to secure. The same wave that's making your team faster is widening the gap between what gets shipped and what gets operated. The queue was already underwater. Now the tide is coming in.
Point your best people at the corner that can hurt you
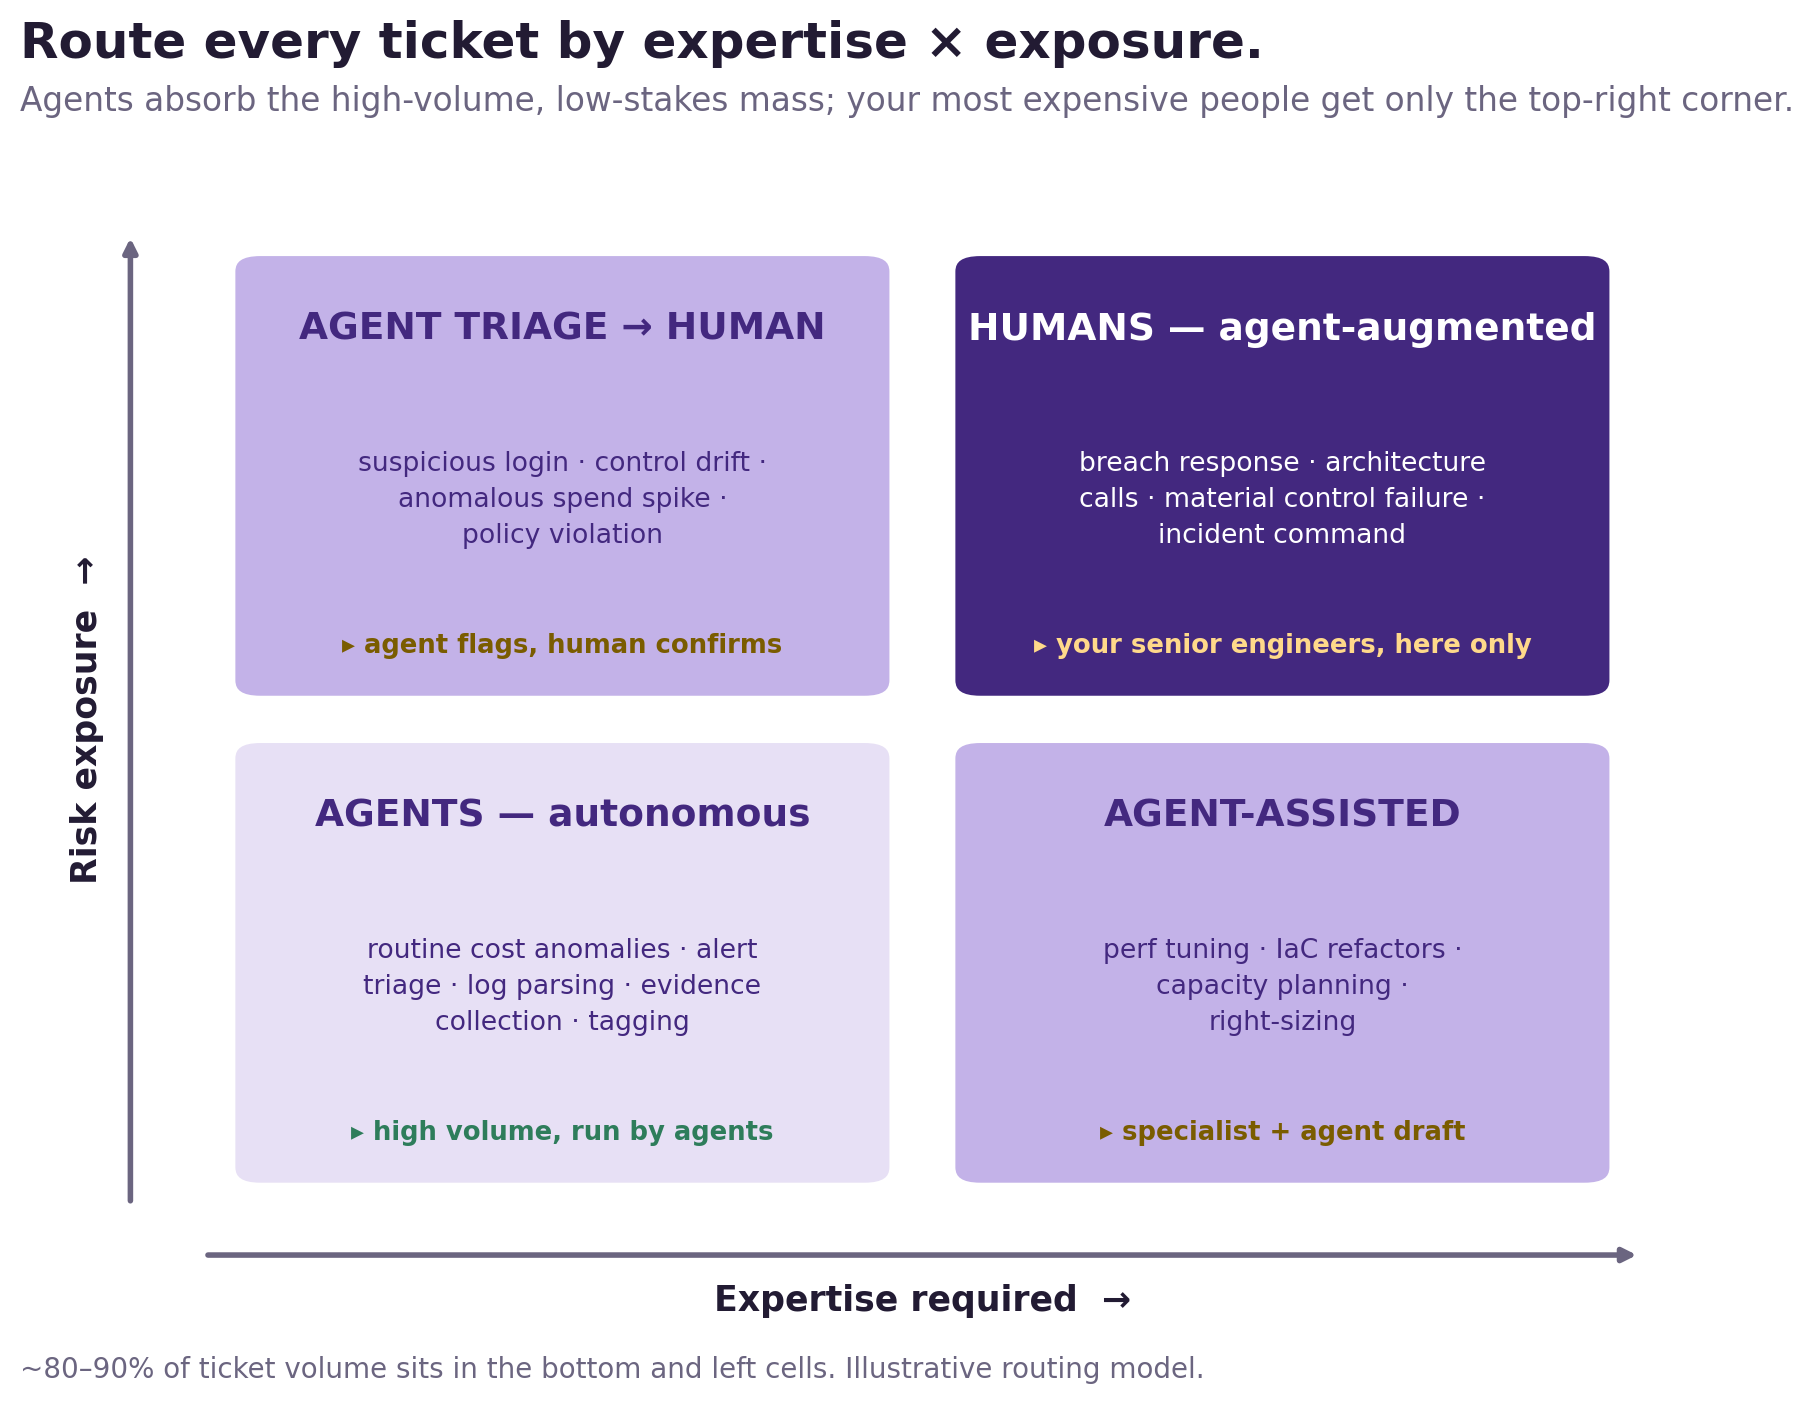
Once you accept that a ticket's real cost depends on what's behind it, the staffing question gets easier. Sort tickets two ways: how much expertise they actually need, and how much is at stake if they go wrong.
Most of your volume needs little expertise and carries little exposure. Routine cost anomalies, alert triage, log parsing, evidence gathering. That's agent work, and it's 80 to 90% of the queue. The opposite corner, a live breach, an architecture decision, a real control failure, needs your most senior people and almost nothing else should. The cases in between are a handshake: an agent takes the first pass and a human signs off, or a specialist moves faster with agent-drafted material.
The point isn't that agents are cheaper at everything. It's that they get the cheap, high-volume work off the desks of the people you pay the most, who never should have been doing it.
It works, with caveats
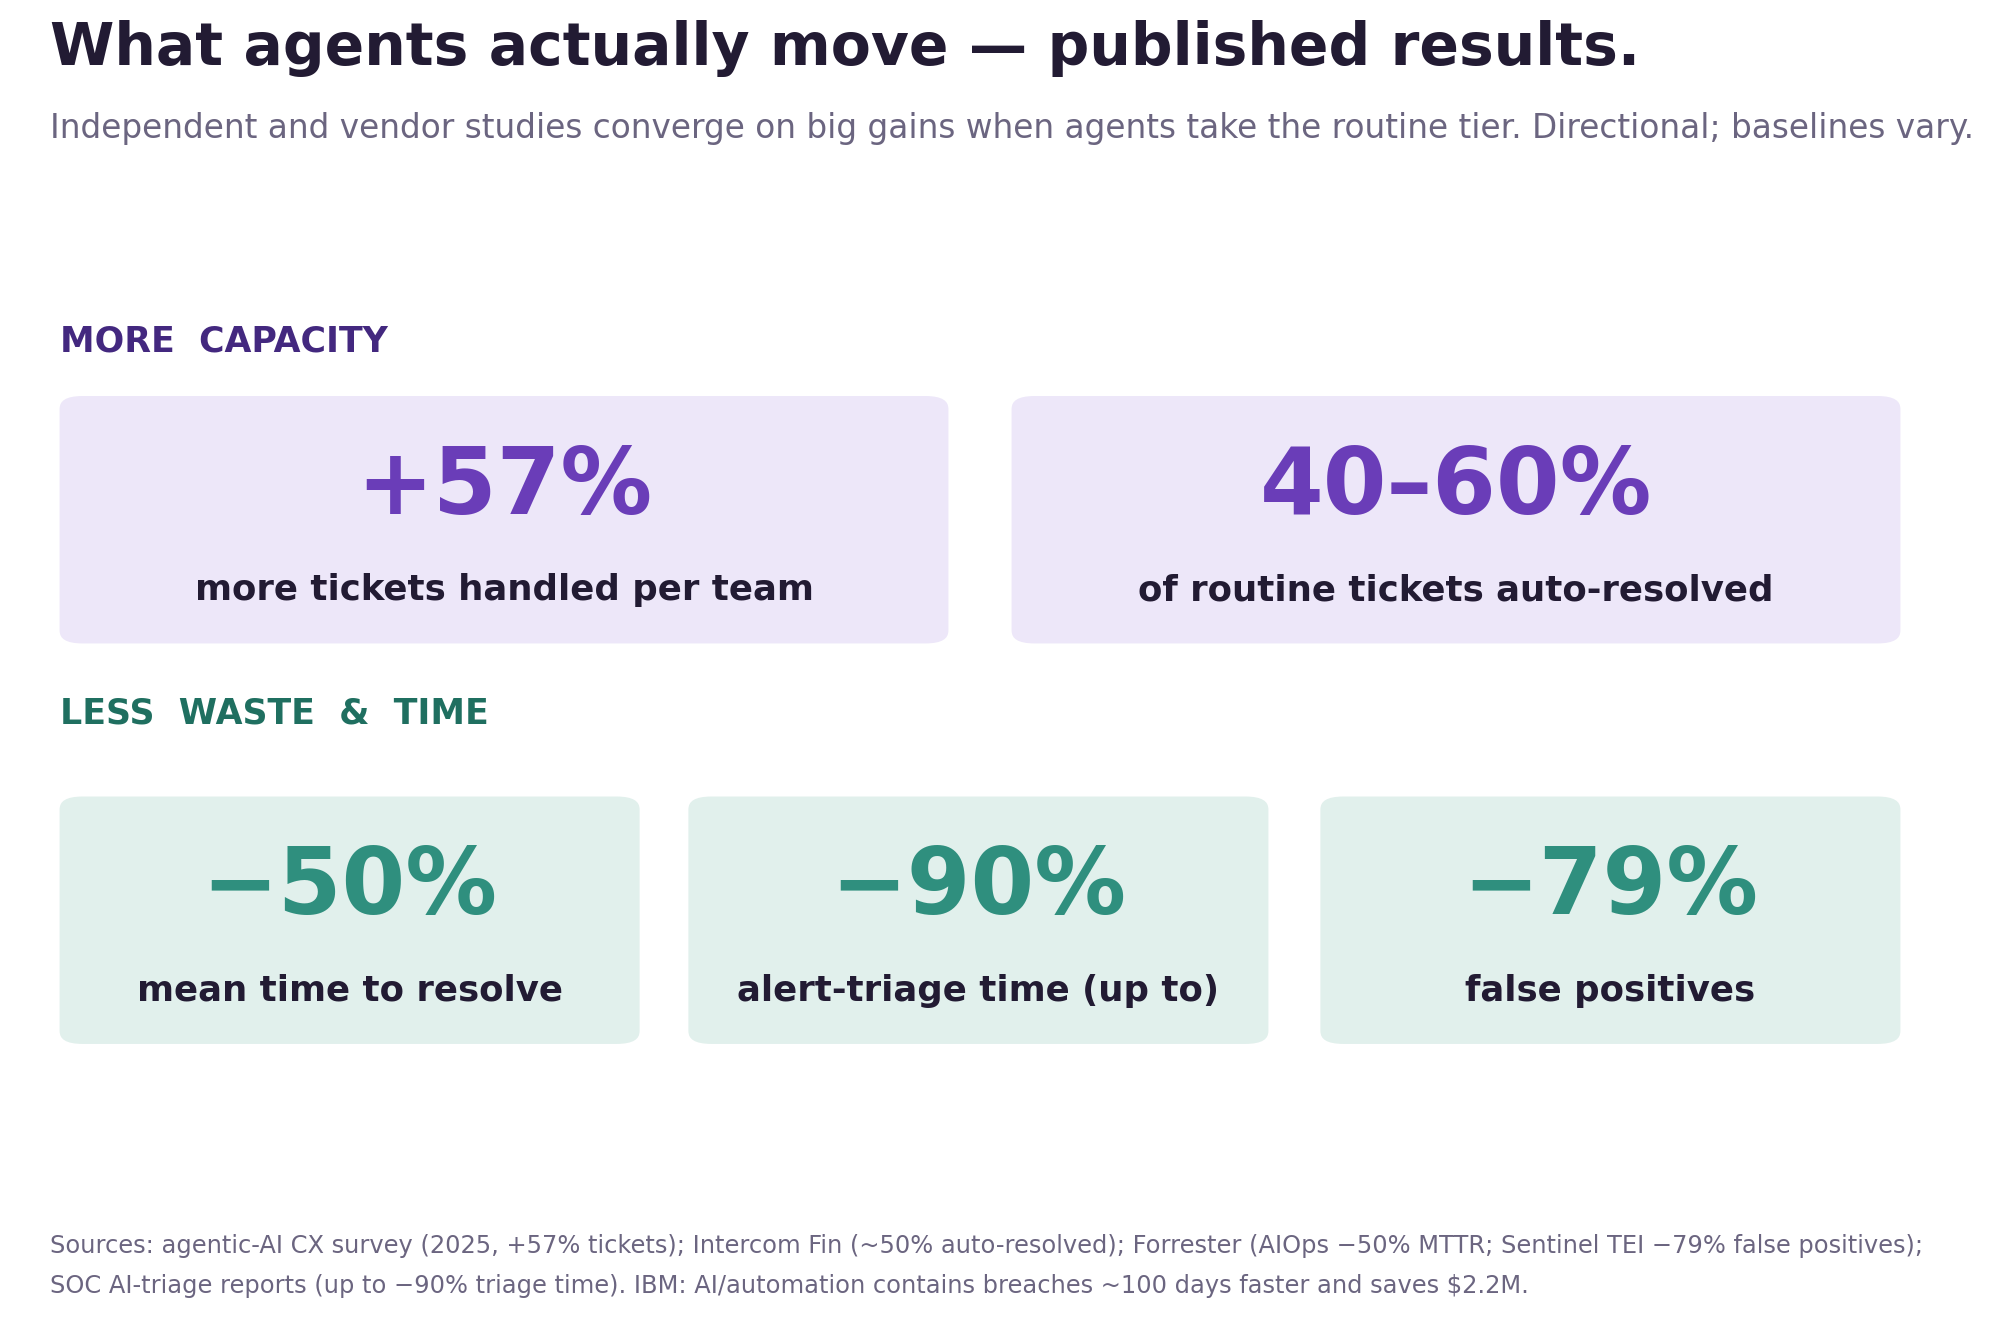
You don't have to take my word for the payoff. A 2025 survey had agentic AI helping support teams handle 57% more tickets. Agents now auto-resolve 40 to 60% of routine tickets, with Intercom's Fin around half. Forrester pegs AIOps adopters at half the mean-time-to-resolve and half as many severe incidents. IBM says AI and automation contain breaches about 100 days faster and save $2.2M apiece.
I'd hold those loosely. They come from vendors and eager early adopters, the baselines vary, and the wins are biggest exactly where the work is high-volume and low-judgment. But the shape lines up with McKinsey's software research: AI roughly halved the time on routine coding and barely moved the needle on the hardest 10%. Cheap where it's repetitive, still human where it's hard. That is the whole routing decision.
You can't bolt this onto a dashboard
Knowing how to triage is the easy part. Actually doing it, routing the tail to agents and watching the token cost so you don't just relocate the bill, is where most tools fall over. Software built for people clicking through screens creates the exact busywork that inflates the cost of a ticket. Google caps SRE toil at 50% of an engineer's time for that reason. AWS's Well-Architected guidance says automate the repetitive, risky work first.
Sticking an MCP endpoint on a click-through product doesn't fix that. Gartner thinks more than 40% of agentic-AI projects will be scrapped by the end of 2027, a lot of them from exactly that kind of veneer. The tools that last are built for humans and agents to work the same queue from day one. Gartner's own estimate has agentic AI going from under 1% of enterprise software in 2024 to about a third by 2028.
The takeaway
Stop pretending every ticket is worth the same. It costs a few dollars to work one and potentially millions to miss the wrong one. So let agents clear the routine tier, keep your specialists for the corner that can actually hurt you, and meter the agents' own cost down to the token so the savings are real, not relocated.
Do that, and the same AI wave that's flooding your queue becomes the thing that drains it. The gap AI coding opened, agents close. That's what we built AlertD to do.
AlertD puts agents on the long tail of cloud-ops work, security, compliance, performance, and cost, so your team spends its time on the tickets that carry real risk. On AWS Marketplace. Learn more →
FAQs
What does it mean that not all tickets cost the same?
A ticket has two costs, not one: the small labor to work it (benchmarked at $6 to $62) and the stakes if it's wrong or never done, which run from reclaimable cloud waste to a million-dollar breach. A single "cost per ticket" average hides that, so you should prioritize by what's at stake, not by where a ticket sits in the queue.
Why do security and compliance tickets cost more than cost or performance tickets?
Their typical ticket is actually cheap too; most security alerts are noise. The difference is the tail. Behind the queue sits a hard-to-reverse event: a breach recovery around $1.5M (Verizon median), or a compliance fine in six figures and up. A cost ticket usually reclaims recoverable waste; a performance ticket is weighted by downtime billed by the hour. Same labor, very different worst case.
How do I decide which tickets to give to AI agents?
Sort on two axes: how much expertise a ticket needs and how much is at stake. Low on both, such as routine anomalies, alert triage, and evidence collection, goes to agents, and that's most of the volume. High-stakes but low-expertise gets agent triage with a human sign-off. The high-expertise, high-stakes corner, breach response, architecture, material control failures, stays with your senior engineers.
Do AI agents actually lower operational costs?
When they're pointed at the right work, yes. Published results are consistent: teams handling about 57% more tickets, agents auto-resolving 40 to 60% of routine ones, and AIOps adopters cutting mean-time-to-resolve roughly in half. The gains are biggest where volume is high and judgment is low, and they only hold if you meter the agents' own token cost, otherwise you move the bill instead of cutting it.
Why isn't a normal SaaS tool enough for this?
Most were built for human-first workflows, which create the toil that inflates a ticket's cost in the first place. Bolting an MCP endpoint onto one doesn't change that, which is part of why Gartner expects more than 40% of agentic-AI projects to be cancelled by 2027. The platforms that work are built for humans and agents to share the same queue.
How does AlertD fit in?
AlertD runs agents across the low-stakes long tail of cloud-ops tickets, cost, security, compliance, and performance, so your specialists stop spending senior hours on junior work. Because it inspects the agents' own token economics with deep prompt inspection, the savings show up on the bill instead of reappearing as inference cost. It's on AWS Marketplace with a free trial.
Sources
HDI and MetricNet (cost per ticket, $6–$62). Flexera State of the Cloud (27–29% of cloud spend wasted). ITIC 2024, Gartner, IDC (downtime $100K–$336K/hour). IBM Cost of a Data Breach 2024 ($4.88M mean; $2.2M saved with AI; ~100 days faster containment) and Verizon DBIR (median ransomware recovery ~$1.5M). Ponemon (True Cost of Compliance). Tenable, Edgescan, Bitsight (remediation backlog). GitLab DevSecOps Survey 2024. Veracode GenAI Code Security 2025 (AI code vulnerability and velocity). Gartner (agentic AI adoption and cancellation forecasts). Forrester, Intercom, Microsoft Sentinel TEI, McKinsey (agent and AIOps results). Google SRE (toil), AWS Well-Architected (automation). Productivity figures are directional and vendor or early-adopter influenced.